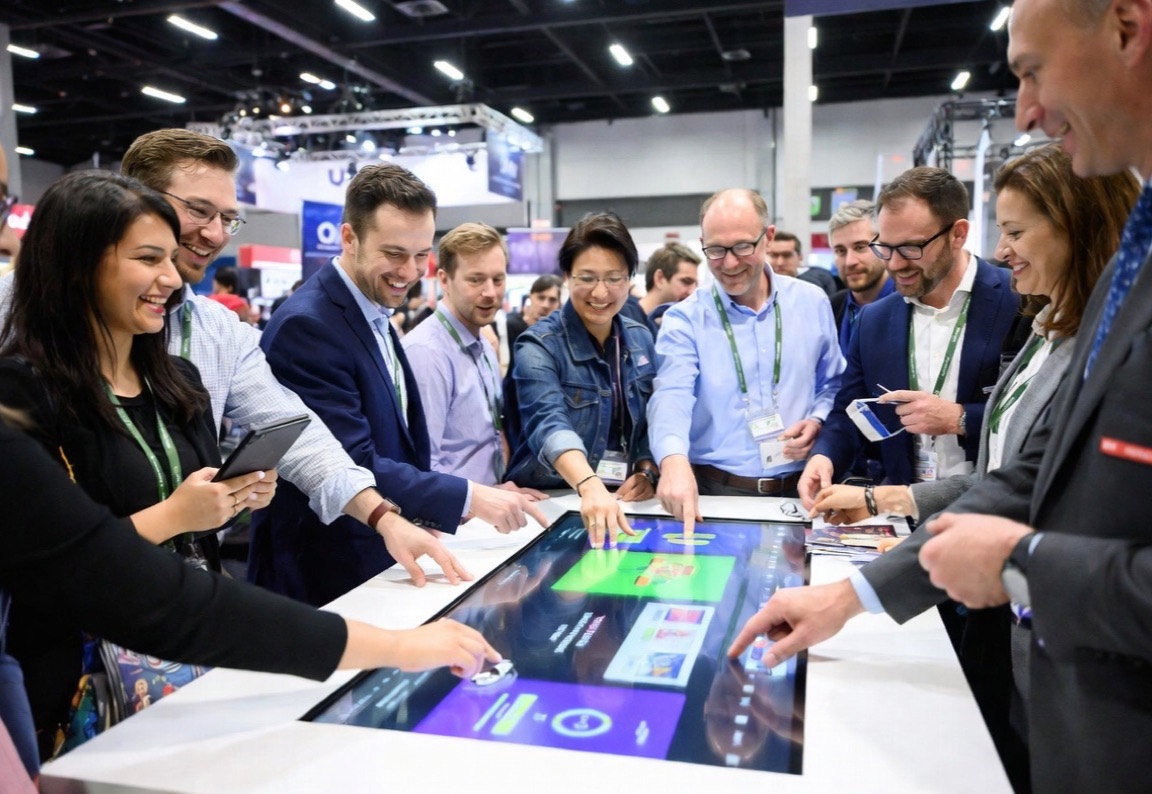
A crowd of laughing attendees plays a game together around a large interactive touch table on a trade show floor

Reality Engineering · Trade Show Measurement · The Field Issue

We prove trade show performance.

Booth traffic tracking that counts everyone: heat maps, dwell time, impressions, and the executive report your leadership actually reads.

1997Founded
200+Events / year
15+Countries
1,000,000+Impressions measured YTD
The Field Issue · Engage / Connect / Measure
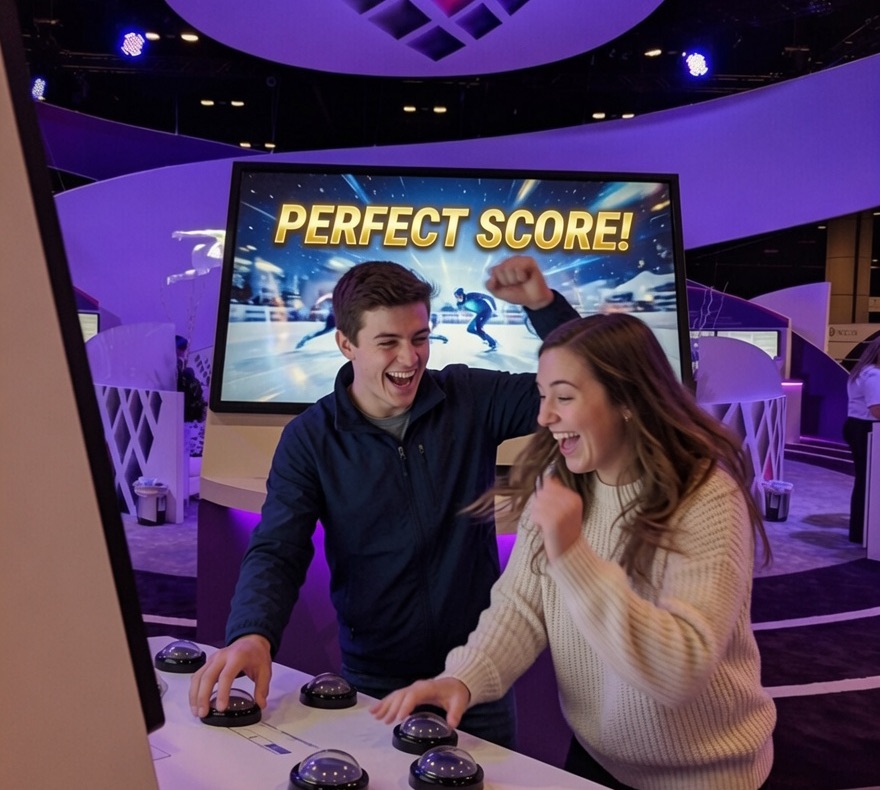
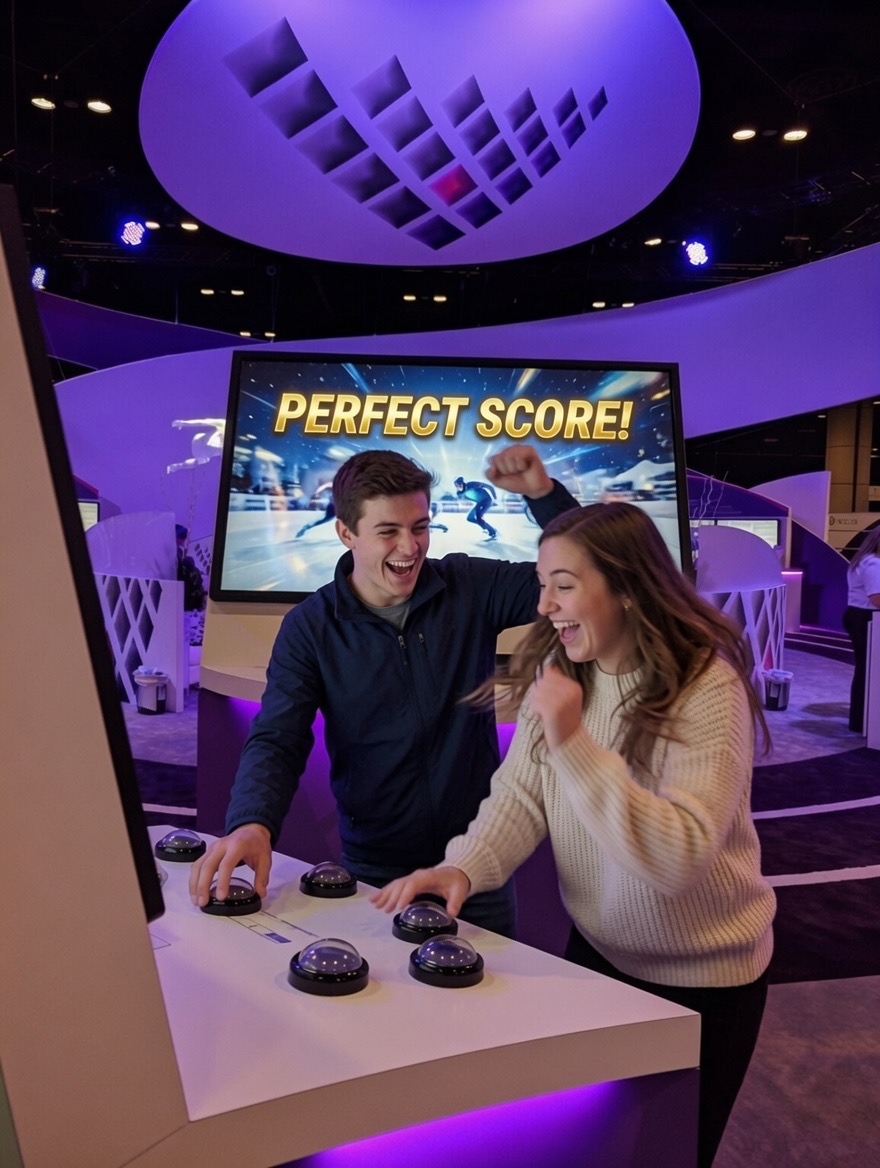
Two attendees laughing mid-game at a button-press interactive
Caught mid-game

Measured for teams at

PfizerJohnson & JohnsonAlconStrykerCanonDeltaCoca-ColaSchneider ElectricOlympusAlkermesNovartisTakedaHoneywellDexcomModernaEssilor

The brief, in one paragraph

Most booths only measure the people who stop and get scanned. Reality Engineering starts with Traffic Tracker: privacy-safe booth traffic tracking that counts every visitor, with heat maps, dwell time, and real impressions. Around it we add reliable event internet for the booth, accurate badge scanning and lead capture, and custom interactive experiences that pull the aisle in. One accountable set of numbers, one executive report that ends the ROI argument.

Filed from the show floor · Washougal, WA · ~200 events a year

The post-show debrief, everywhere

“How did the booth do?”“It felt busy.”

of booth visitors never get scanned. Their interest, their dwell, their story: gone when the carpet comes up.

Badge scans see 2 of these 10 people. Your budget paid for all of them.

We count everyone. No badge, no camera, no opt-in.

Traffic Tracker™ uses passive, privacy-safe LiDAR to cover 100% of your booth footprint in real time. Anonymous dots, never faces. So the next debrief starts with numbers, not adjectives.

“What happened, from accurately generated data.”

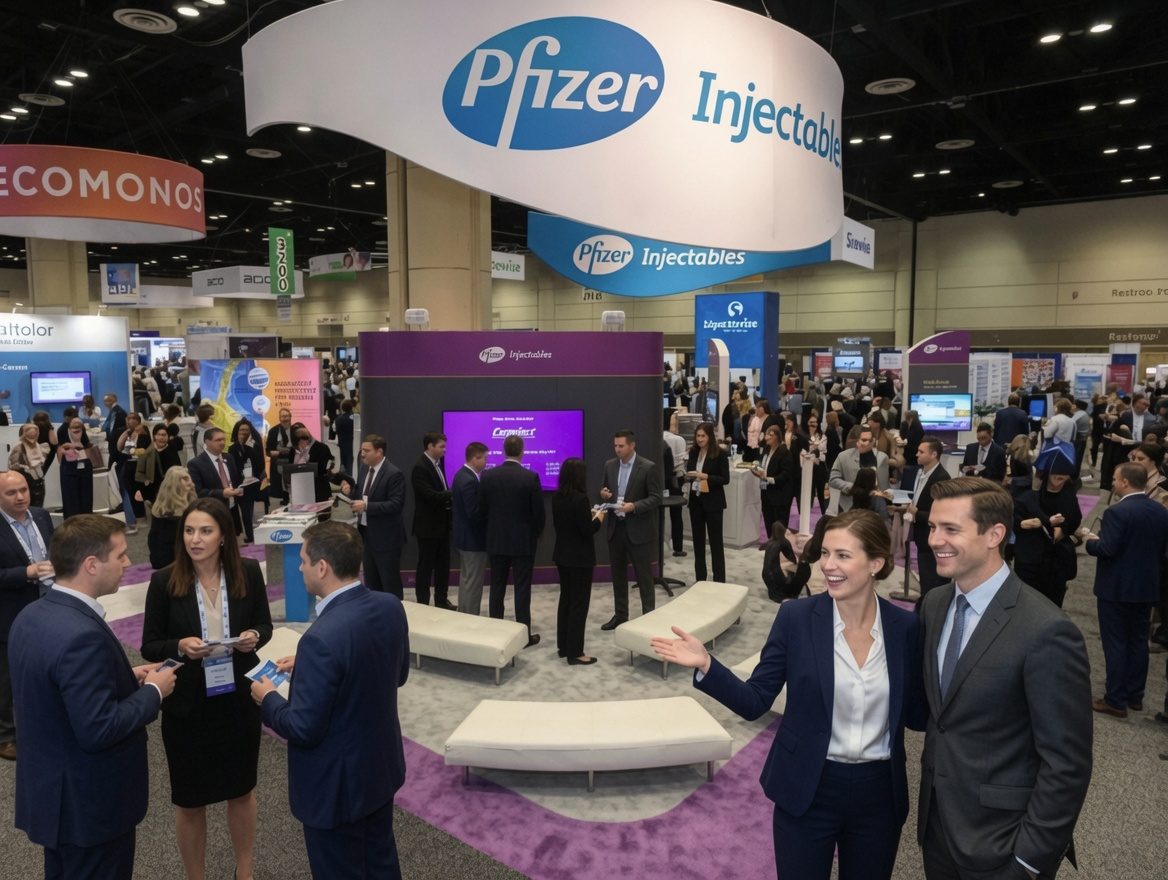
Two smiling attendees in the foreground of a busy trade-show aisle lined with booths and passing visitors
One aisle, one afternoon. Every person here counts, so we count every person.

Fig. 02Main aisle, day two. The 80% who never scan are all in frame.

A dense crowd of attendees moving through a convention hall aisle under high ceilings

Fig. 03The raw material: a floor full of people your budget already paid to reach.

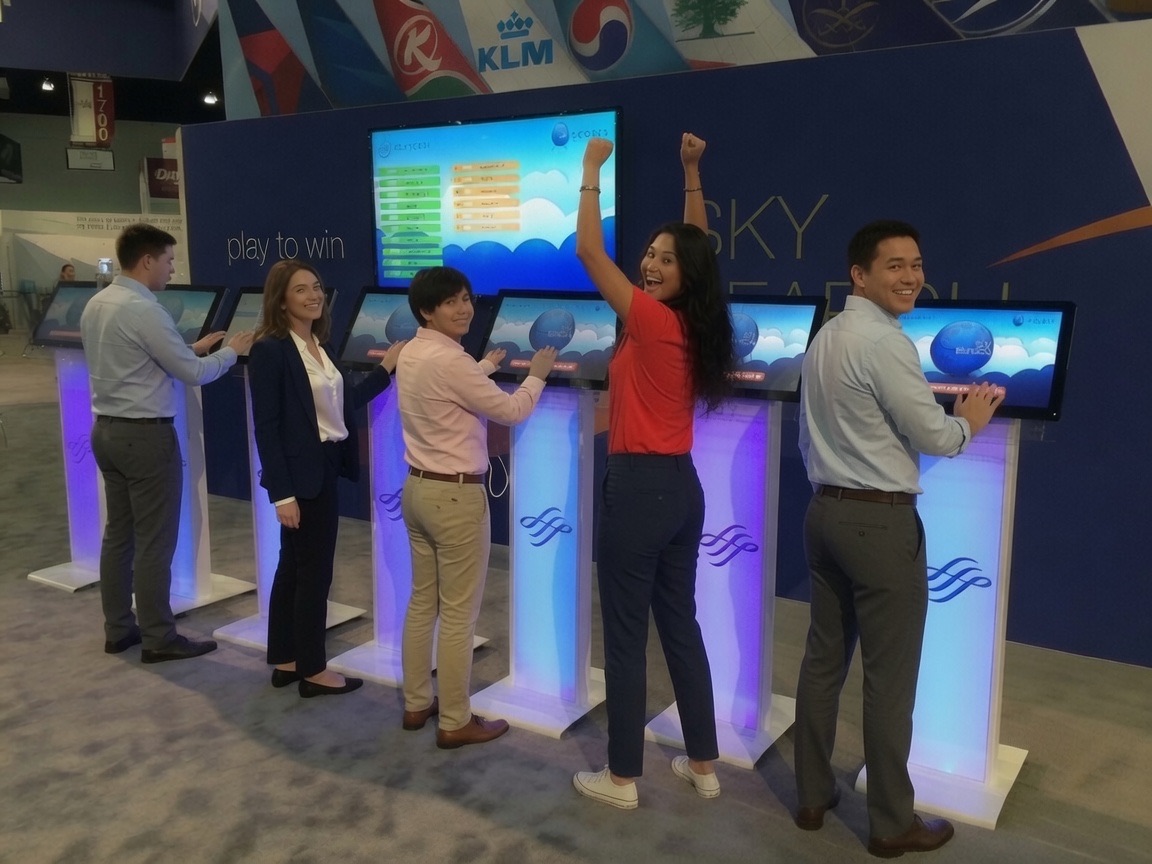
A row of branded interactive kiosks standing ready before the hall opens

Fig. 04Kiosk row, twenty minutes before doors. Every station logs what happens next.

An attendee slams a glowing buzzer at an arcade-style booth game

Fig. 05The buzzer, mid-slam. Logged as one engagement.

Field note. The crowd, the machine, the moment: three things every booth has. What most booths never get is the fourth: a count. The rest of this issue is about the count.

The method · how the proof gets made

Engage the crowd. Connect with every lead. Measure it all.

One team, one platform, one accountable number at the end. We handle your tech, so you shine.

01 · Engage · prove engagement

Draw the crowd

RE:quest interactive experiences

Attention is earned. Interactive experiences give attendees a reason to stop, and a reason to badge in.

  • Touch & gesture games: memory match, arcade catch, spin-to-win with live prize inventory and contest-rule logic
  • Trivia & timed quizzes with leaderboards
  • Selfie Station Kiosk: no green screen; live backdrops and props; print, post, or email
  • Educational interactives and audience response systems
  • Sweepstakes engines built for show-floor rules
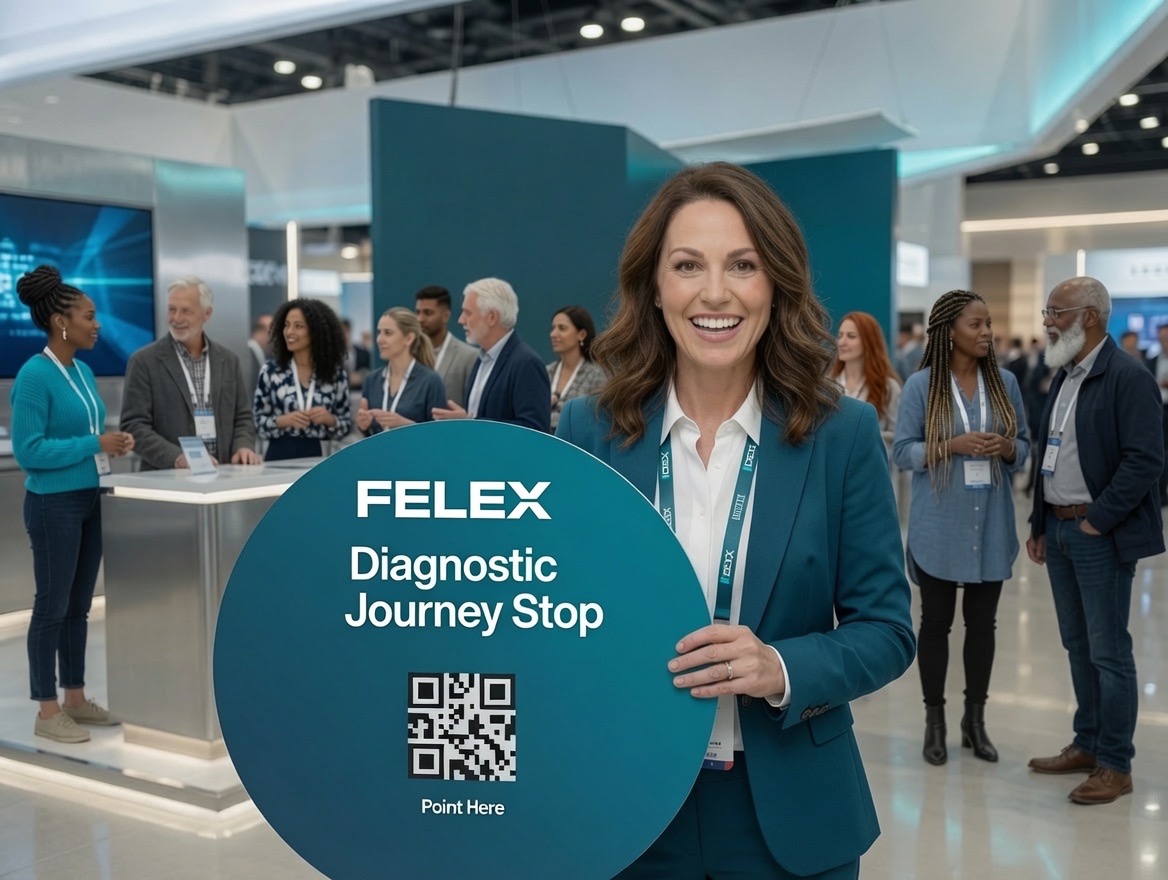
A smiling team member welcomes attendees with a round interactive game sign
Fig. 06 · The first hello does half the engaging

02 · Connect · prove every lead

Capture every lead

RE:nvent lead platform

Lead capture that fits the conversation, on rented iPhones or your reps’ own phones.

  • RE:nvent Mobile branded lead app: custom contact fields, branching surveys and qualifiers
  • Live NPI Match: under 1 second against the full NPI database at point of scan
  • VIP Target Matching: ribbon match / business-intelligence pop-up
  • Digital media delivery: instant branded email; scheduled thank-you follow-ups
  • Meeting Scheduler: multi-location visual calendar, Meeting Wizard, auto invites + SMS reminders, one-tap check-in, no-show tracking, CSV export
  • Real-time dashboard + Salesforce/CRM integration included
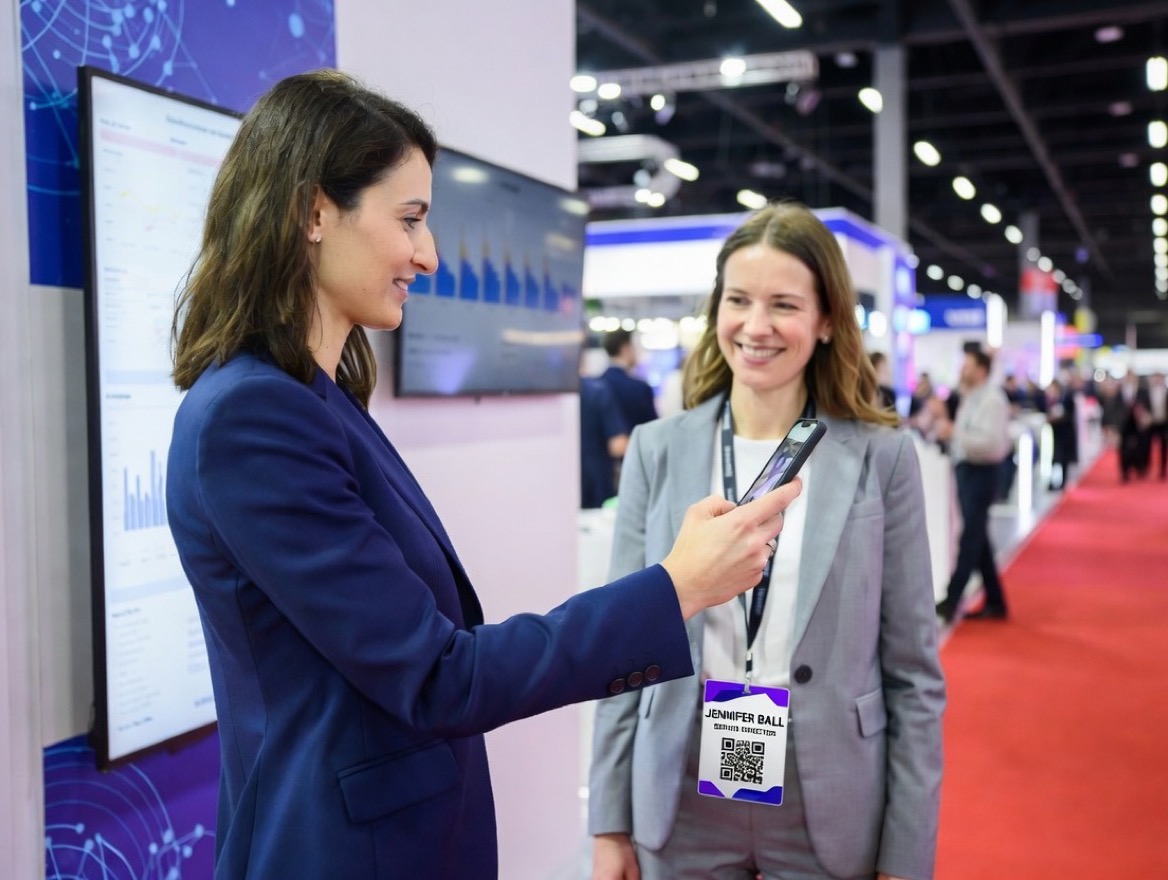
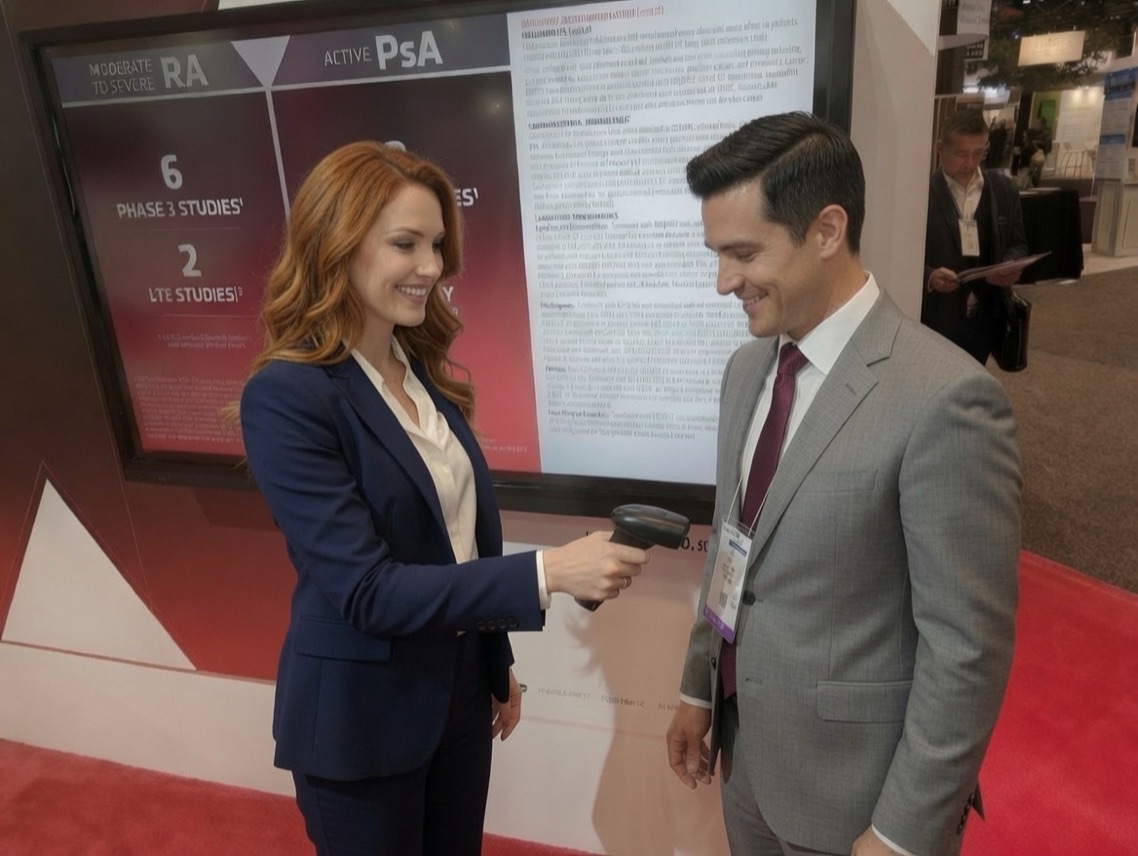
A staff member scans an attendee’s badge with a handheld device at the booth
Fig. 07 · Captured at the moment of contact

03 · Measure · prove ROI

Count the whole booth

Traffic Tracker™ + RE:ports

Passive LiDAR analytics across the whole footprint, distilled into an executive report leadership actually reads.

  • 100% booth coverage: anonymous dots, no cameras, no facial recognition, zero attendee opt-in
  • Real-time private dashboard during the show
  • Traffic & dwell heat maps, zone-to-zone flows, impressions per hour
  • RE:ports executive reporting: the executive summary that follows every show
  • Benchmarking with identical methodology across exhibitors, confidential to participants
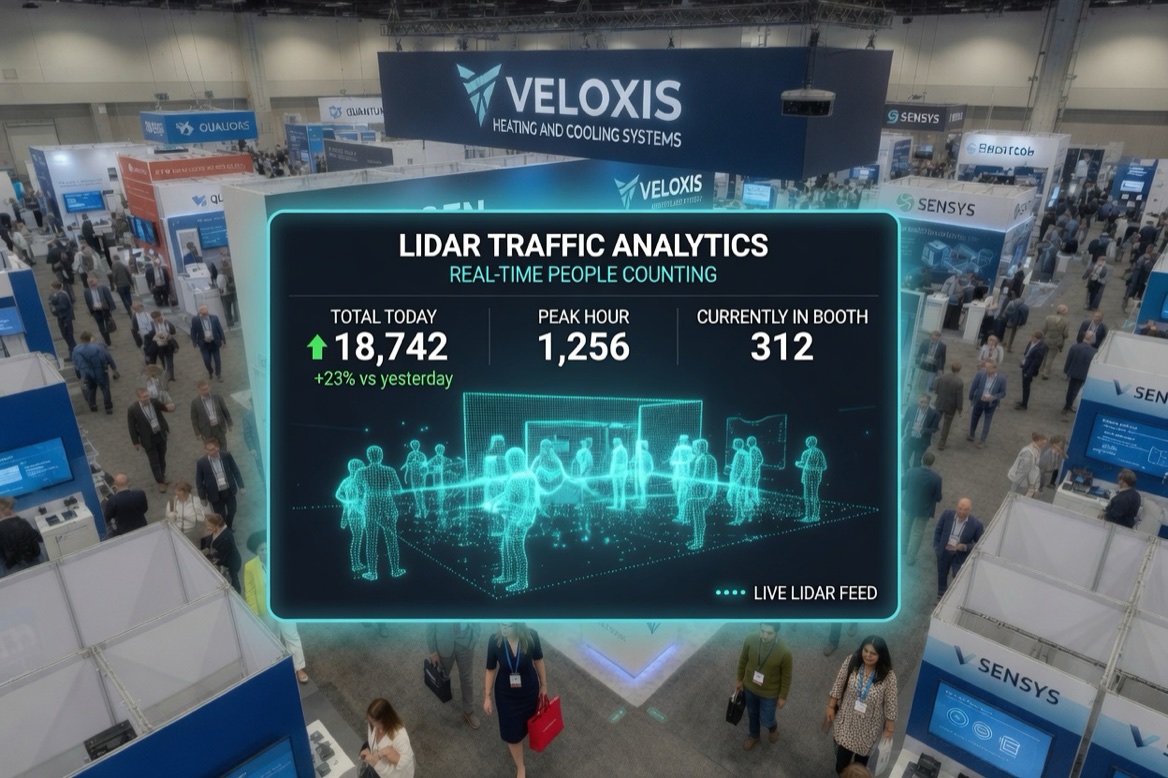
Stylized aerial of a trade show booth with a real-time traffic analytics dashboard counting visitors
Fig. 08 · The whole footprint, counted from above

The house position

Prove ROI. Prove attendance. Prove engagement. Prove staffing decisions. Replace opinions with evidence.

Prove attendance · Traffic Tracker™, the flagship

Badge scanners see the 20% who stop to talk. LiDAR sees the whole booth.

Compact sensors mounted at height track anonymous movement across every square foot: who slowed down, where they lingered, which zones they visited in what order, and who watched from the aisle without ever stepping in.

impressions onlookers · within 4–5 ft, ≥2s, never entered dwell vs. stationary qualified dwell >60s zone visits · total vs. unique zone-to-zone Sankey flows impressions per hour traffic & dwell heat maps
Traffic Tracker™ · Booth 4021 LIVE
STORAGE ENTRANCE ENTRANCE AISLE THEATER PRODUCT ZONE A DEMO STATION PRODUCT ZONE B MED INFO DESK HOSPITALITY WELCOME AREA LEGEND (IMPRESSIONS) 0 2,312
19,631Impressions
4m 42sAvg dwell
83,906Onlookers

Fig. 09The live view: your private dashboard, all show long. At right: how the same data lands in the deliverable.

Traffic Heat Map

TRAFFIC TRACKER™ DASHBOARD · ILLUSTRATIVE
Layers

Fig. 10The heat map is your booth’s “carpet friction”: popular entrances, natural paths, and the dead corner nobody warned you about.

Plan

3D booth model and zone mapping before the crates ship: every hotspot named, every question assigned a zone.

Install

Compact sensors placed at height or on trusses. WiFi provided. No cabling drama, no booth redesign.

Capture

Anonymous, real-time tracking of every visitor and onlooker. Watch it live on your private dashboard.

Analyze

The dashboard tells you today; the executive report tells leadership the whole story.

Pull quote · the whole point

Findings become Monday-morning decisions.

Every metric in the report pairs with the action it suggests. Three examples below.

Read the finding, make the call

IF → THEN

High traffic, short dwell. They came, they skimmed, they left.

Add a demo moment or clearer signage where they stall.

Peak traffic 11–1. Your busiest window is also lunch.

Staff up before the rush, not after it.

High dwell, few leads. Real interest is leaking away unrecorded.

Add a badge-scan moment where the engagement already happens.

Benchmarking available with identical methodology across exhibitors. Results confidential to participants. Unique visits count real reach without double-counting; the Sankey shows which zones naturally pair in attendees’ minds.

The full instrument · Traffic Tracker

Prove staffing decisions · one report, seven readers

Every seat at the debrief sees their own answer.

Run the floor on evidence, not instinct.

“Where are the bottlenecks, and when do I need bodies?”

Heat maps expose choke points and dead corners. Zone flow shows how attendees actually move, not how the floor plan assumed they would. Impressions per hour tells you exactly when to staff the peaks.

Watches

Traffic heat mapspopular entries, dead corners

Zone-to-zone flowreal circulation patterns

Impressions per hourstaff the peaks, fix the lulls

Prove the message held attention.

“Did the creative actually stop anyone?”

Average dwell and impressions-by-dwell separate quick passersby from deeply engaged visitors. Unique visits measure real reach without double-counting: the number your agency can’t hand-wave.

Watches

Average dwell timeattention, quantified

Impressions by dwellskimmers vs. the engaged

Unique visitstrue reach, no double-counting

See cross-product interest you can’t survey for.

“Do visitors to one product zone explore the others?”

Zone visits and Sankey cross-flow reveal which product areas naturally pair in attendees’ minds. Qualified dwell shows where interest turned into real time spent.

Watches

Zone visits, total & uniquedemand by product area

Sankey cross-flowwhich zones pair naturally

Qualified dwell >60sinterest with depth

Know whether the education landed.

“Are HCPs spending real time with the science?”

Zone dwell in scientific and med-info areas, plus congregation heat maps, shows whether educational content earned genuine engagement or a polite walk-by.

Watches

Zone dwell, scientific areastime with the content

Congregation heat mapswhere discussion clusters

Qualified dwell trendseducation vs. exposure

Put reps where the value is.

“When’s the rush, and who’s worth the conversation?”

Qualified visits flag high-value visitors by behavior, not badge title. Hourly traffic tells the team when to be on the floor at full strength, and when to book meetings instead.

Watches

Qualified visitsbehavioral buying signals

Hourly trafficstaff the rush precisely

Return visitor ratewho came back for more

ROI you can defend in the budget meeting.

“Was the booth worth it, and can I prove it?”

Heat maps and zone totals at a glance, year-over-year deltas, and a scorecard with plain-English statuses. One page that survives the CFO’s questions.

Watches

Heat maps at a glancethe whole story in one visual

Zone totals & YoYgrowth you can point to

Performance scorecarddefensible line items

The report that gets your client to rebook and build bigger.

“Did the booth we built earn its footprint?”

Walk into your client’s debrief with proof the booth worked, with your client’s brand on the cover. Zone data shows which build elements pulled, dwell shows where the design held attention, and the year-over-year line makes the case to build bigger.

Watches

Impressions vs. last yeargrowth your client can point to

Zone performance by build elementwhich parts of the build pulled

Dwell at your feature momentsthe showpiece, quantified

Pull quote · the measurement standard

Impressions counted, not estimated. Dwell measured, not remembered.

Every stakeholder reads a different page. Every page rests on the same count.

Prove the whole picture · three data streams

Everything we build measures something.

Traffic tracking answers where. Badge scanning answers who. Engagement activities answer what. Each stream is useful on its own. Combined, they are the complete picture.

Traffic data

WHERE

LiDAR maps every path, dwell, and zone visit across the footprint, visitors and onlookers alike.

Scan data

WHO

Badge scans attach a name, role, and institution to the visit, captured compliantly at the moment of contact.

Engagement data

WHAT

Every interactive logs the topics visitors chose and the questions each one answered.

What’s next

Where, who, and what: the complete picture, cross-referenced in one dataset. That is the ground for data-driven decisions, and the executive report below is where it lands.

Prove ROI · RE:ports, the deliverable

Live on the dashboard all show. Then this lands in your inbox.

SampleExcerpt from a full report

Not a data dump. An executive summary built to be forwarded upward, the kind that makes you the most prepared person in the debrief. Below: five sample pages, with client and zone names generalized.

Rebranded in any client color system

Reality Engineering

Executive
Summary

[Conference Name] 2026

[Venue, City]
Three expo days · 32 booth zones tracked

Prepared for [Client] · Commercial

19,631Booth Impressions
503Total Unique Leads
577Total Engagements
41,584Zone Total Visits

4m 42s avg dwell · 12,500 qualified impressions · 43% stationary ratio · 17.6% return visitor rate

Traffic Tracker LiDAR Analytics · Badge Scan Lead Capture

CONFIDENTIAL | For Internal Distribution OnlyPrepared by Reality Engineering

01 · The cover is the elevator pitch

Four numbers your leadership reads before the elevator doors close. Impressions counted by LiDAR, not estimated from badge scans, sit beside leads and engagements, so scale and quality land together.

02 · The visitor quality story

From 83,906 aisle onlookers to 3,693 visitors who stayed ten minutes or more. This funnel is the single chart that reframes the booth conversation from “how many” to “how deeply.”

The Visitor Quality Story

2026 [Conference Name] | [Client] Commercial

83,906Perimeter Onlookers · observed booth from outside
19,631 (100%)Entered the Booth · Exhibit Impressions
12,500 (64%)Stayed ≥1 Minute · qualified visitor threshold
9,214 (47%)Stayed ≥2 Minutes · substantive engagement
5,907 (30%)Stayed ≥5 Minutes · deep engagement
3,693 (19%)Stayed ≥10 Minutes · highest intent visitors
CONFIDENTIAL | For Internal Distribution OnlySource: Traffic Tracker LiDAR Analytics

Impressions Per Hour · 3-Day Overlay

2026 [Conference Name] | [Client] Commercial

Hourly booth impressions by show day

All three expo days overlaid, 8 AM – 6 PM

Key Insight

Traffic crests between 10 AM and noon every day, topping out at 1,435 impressions in the 11–12 hour on Day 1, and softens 1–2 PM across all three days.

Staffing Call

Front-load Day 1 at full strength; use the consistent lunch dip as the natural staff-rotation window.

CONFIDENTIAL | For Internal Distribution OnlySource: Traffic Tracker LiDAR Analytics

03 · Hour-by-hour truth

Three show days on one chart. Staff the 11–12 peak, rotate through the lunch dip, and stop guessing which day earned the budget.

What leadership sees

Performance Scorecard

2026 [Conference Name] | [Client] Commercial

MetricResultStatusNote
Booth Impressions19,631StrongLiDAR count, all 3 days
Unique Leads503StrongDeduplicated across 6 stations
Return Visitor Rate17.6%NotableNearly 1 in 5 came back
NPI Match Rate39.5%MonitorAdd capture prompt at scan
Avg Booth Dwell4m 42sStrongWell above 1-min threshold
Qualified Impressions12,500Strong64% stayed ≥1 minute
Day 1 Engagements339Strong+7% vs. prior year
Day 3 Engagements61Needs AttnReinvigorate final-day programming
Avg Zones per Visitor3NotableCross-zone exploration healthy
US Lead Share71%Strong357 of 503 unique leads
CONFIDENTIAL | For Internal Distribution OnlySource: Traffic Tracker LiDAR Analytics · Badge Scan CSV exports

04 · What leadership sees first

The scorecard your CFO reads top to bottom, yours or your client’s, honest reds included. Plain-English statuses: Strong, Notable, Monitor, Needs Attention. A note column says what to do about each line.

Strategic Recommendations

2026 [Conference Name] | [Client] Commercial

Every recommendation below traces to a metric earlier in this report. None of them generic.

01

Double Down on Day 1

Concentrate premium staffing and headline activations where the traffic actually is.

02

Reinvigorate Day 3 Programming

Scheduled sessions or incentives to counter the final-day engagement drop.

03

Amplify High-Dwell Zones

The deepest-attention zones earn expanded footprints next cycle.

04

Improve Peripheral Discovery

Wayfinding and sightline changes to pull traffic into under-visited corners.

05

Work the Anchor Zone

Route staff introductions through the booth’s natural gravity center.

06

Enhance NPI Match Rate

Point-of-scan prompts and station placement to lift verified matches.

CONFIDENTIAL | For Internal Distribution OnlyPrepared by Reality Engineering

05 · Monday morning, handled

Six recommendations your team can act on Monday morning, each one traced to a number earlier in the report, sequenced for the next planning cycle.

ALSO INSIDE Traffic & dwell heat maps · zone visit Sankey flow · zone-by-zone rankings · year-over-year deltas

06 · Five pages of thirty-three

These pages are a sample. The full deliverable runs 30-plus, every one built to the same standard. To see a complete report, and what yours would look like, register for a demonstration.

See a full report · book a demo

Proof, on the record

Case Studies

The numbers our clients take into their budget meetings. We don’t publish this work with names attached. The same discretion protects your data too.

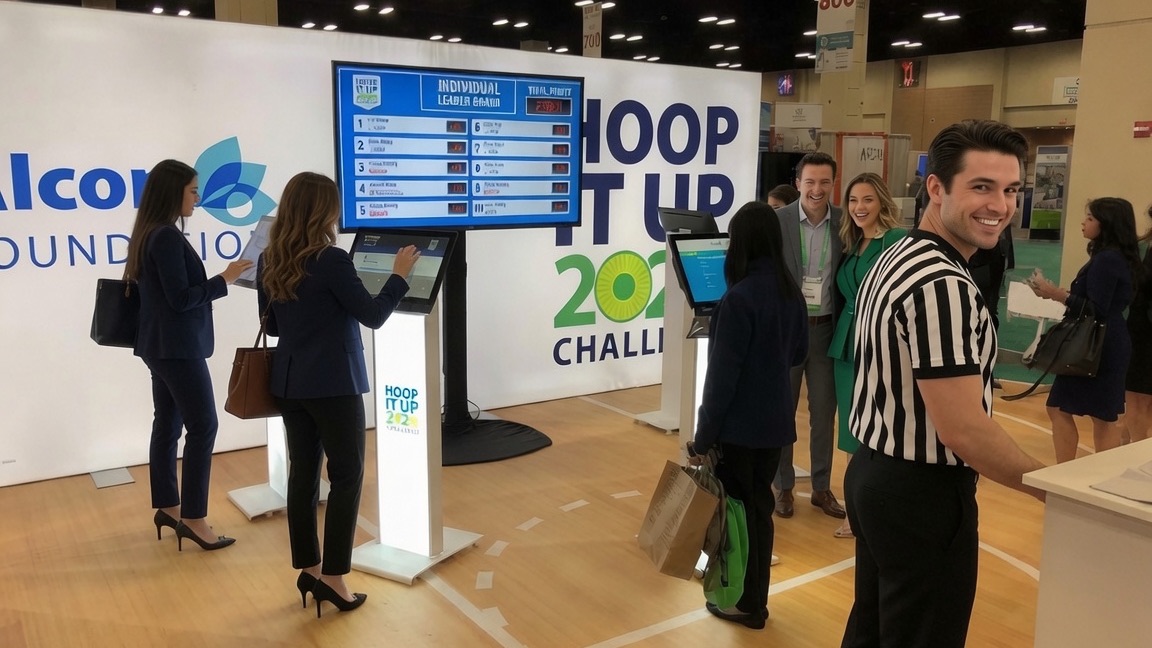
A group of attendees, one in referee stripes, smiles beside a basketball-challenge kiosk and live leaderboard screen
The satellite boothFig. 11 · 20x30 charitable activation

Charitable basketball activation · optometry congress

2,679games played · +33% over goal
1:09average dwell
$25,000donated

For the charitable foundation of a global eye-care company.

“We had far greater activity taking place in this 20x30 satellite booth than in our main booth over four times the size.”
Senior Marketing Manager

Light-chandelier quiz activation · a global ophthalmic lens leader

1,325+leads captured
+198%growth over two years

Two years of identical methodology made the growth number defensible.

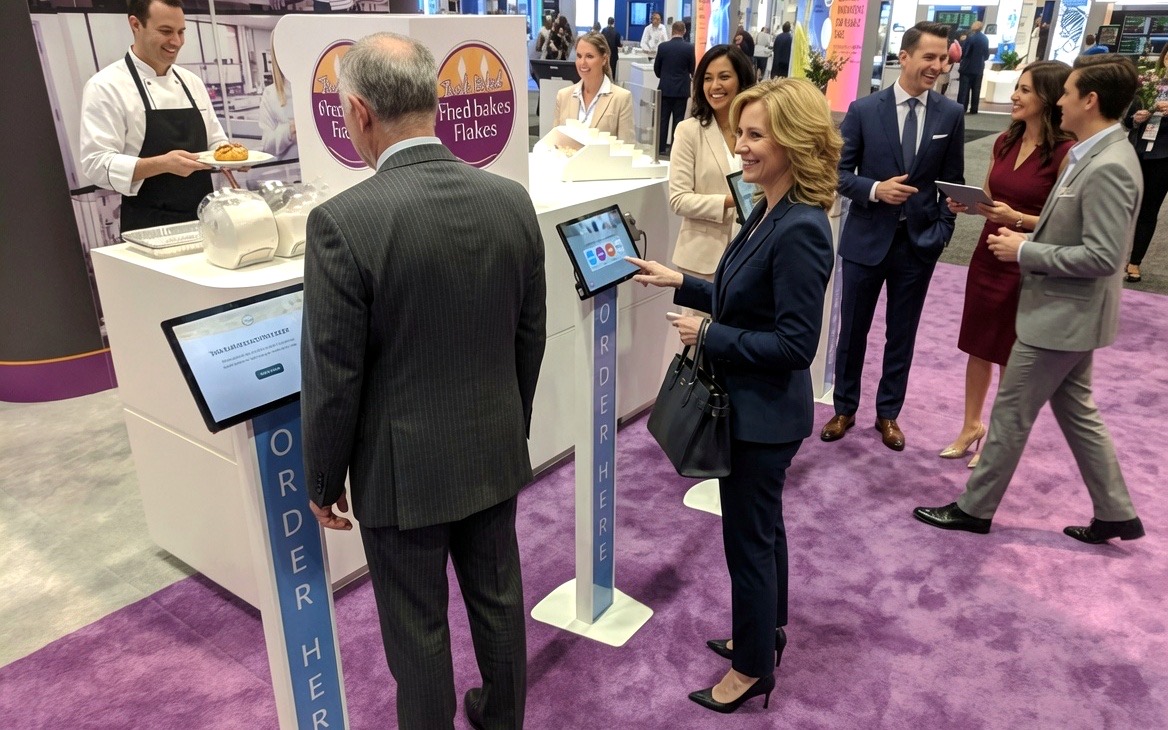
A chef serves fresh pastries beside self-serve ordering kiosks while attendees mingle on a purple show-floor carpet
Hospitality, rebuiltFig. 12 · Flow instead of lines

VIP hospitality · critical-care exhibitor

+86%exhibit impressions YOY
+71%guests served
“You elegantly addressed our need to eliminate the long line going through our booth while increasing traffic.”
Senior Marketing Manager

Spin-to-Win · HVAC exhibitor

60%of scanned attendees played
78%opted into communications
12%requested immediate follow-up

A game that qualified leads while it entertained them.

More case studies, in depth

For exhibit houses & agencies

We make exhibit houses shine. Your build, measured. Your client’s brand on the report. You look like the hero. You are the one who brought the proof.

Partner with us The renewal conversation, made easy

Prove compliance · healthcare & pharma

Compliance isn’t a feature. It’s the architecture.

Compliant HCP data capture at medical congresses since 2016: booths, product theaters with check-in, meal opt-out and signature capture, symposia, educational receptions, and KOL & delegate meetings.

2016HCP capture since
~200events annually
Dailycompliance data delivery
A staff member scans an attendee’s badge in front of a pharmaceutical information wall
Fig. 13 · Compliant capture, at the moment of contact

CAPTUREBadge scanning, ready in minutes

RE:nvent Mobile with event QR setup, 15-minute staff training, and Badge API integration where the show provides one.

CAPTUREImage capture with OCR

Snap the badge; OCR extracts the record and routes the attendee into the compliance survey.

CAPTURESelf-service QR registration

Attendees register on their own phones. Only US prescribers get the full question set; a completion screen is shown for entry.

CAPTUREList import & delegate check-in

For badge-less or scan-prohibited events: lookup-style pre-reg entry that finds the name as staff type, with real-time NPI lookup and attendee-confirmed matches. We can also ingest event-provided scanner data post-event.

COMPLYLive NPI Match, at the point of scan

Under one second against the full NPI database. NPI number, license state, and taxonomy included in every export.

COMPLYSunshine Act, handled properly

Transfer-of-value for US prescribers at sponsored meals, reported through your transparency team to CMS. Survey branching keeps the right questions in front of the right people.

COMPLYGlobal disclosure coverage

International disclosure support expanded by 11 countries in 2025, including Brazil, France, Italy, Netherlands, Portugal, Saudi Arabia, and Turkey. GDPR and US state privacy aware.

Live NPI Match Sunshine Act TOV Survey branching GDPR & state privacy Encrypted, password-protected reports Daily compliance delivery
Healthcare & pharma, in depth

On the floor with you

One partner from concept to final report.

We handle your tech, so you shine. That includes the connectivity everything else depends on.

Booth Internet & WiFi

Demos that never drop. Streams that never stutter.

Plug-and-play dedicated or shared connectivity, hardline or Wi-Fi, engineered for booth applications and video streaming. Connectivity you stop thinking about, at a fraction of the show-services price.

Dedicated or sharedHardline or Wi-FiStreams videoBuffering wheels not invitedA fraction of show-services pricing

Software

RE:nvent platform

The trade show software foundation behind every activation: lead capture, games, scheduling, dashboards.

People

Account management

One contact from concept to onsite to final report. Deadlines kept, budgets kept.

Build

Custom design & programming

In-house designers and engineers build custom modules on the RE:nvent foundation, not off-the-shelf templates.

Hardware

Hardware rental

Handhelds, iPads, a kiosk family in three sizes with custom powder-coat and LED, tablet and touchscreen PCs, on-board badge scanners, booth networks. No internet required.

Support

On-site tech support

24/7 once we’re onsite. If something blinks at 7am on day two, it’s our problem, not yours.

Registration

Badge registration & printing

Pre-reg lists, onsite walk-ups, and no-show reporting.

Outreach

Pre-event email blasts

Fill the calendar before the crates arrive.

Every service, itemized

The truth standard

Report facts, not narratives.

Founded in 1997 in Vancouver, Washington; headquartered in Washougal today. In-house designers, programmers, and engineers who’ve shipped roughly 200 events a year across 15+ countries. We quote realistic capture rates and stand behind every number: accurately generated, fully defensible.

Industries Pharmaceutical · Healthcare · Construction · Beverage · Consumer · Automotive · Finance · Aerospace
End of issue Prove it to your CFO. Or your client’s. Doc. No. RE-2026-H

This has been a sample. The real one is about your booth.

Live on your private dashboard while the hall is open, then delivered as the document your leadership actually reads. Start with a 30-minute discovery call. No commitment. Just clarity, plus a full sample report so you can see exactly what you’d get.

Prepared for[ Your name here ]
SubjectYour next show
StandardReport facts, not narratives
StatusWaiting on one email
Hello@RealityEngineering.com (360) 448-6361 Washougal, WA · at your show floor worldwide
Reality Engineering Engage · Connect · Measure Back cover