
Traffic Tracker™ · Booth analytics
Heat maps, dwell time, and impressions from every entry and every path, measured with passive, privacy-safe LiDAR. No cameras, no badges, no opt-in.
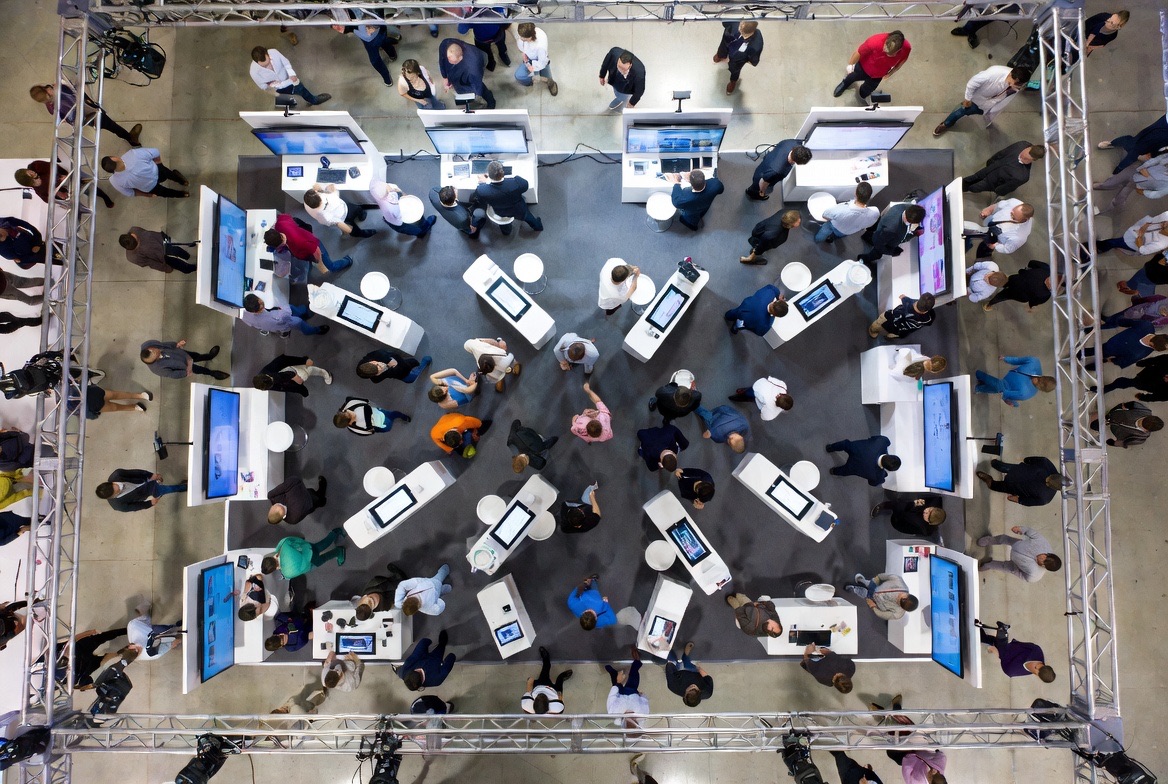
Fig. 01·The tracker's view: one booth, top-down, every visitor in frame
N=19,631 · 3-day sample · Sensors 4The instrument · Live from the floor
80% of booth visitors never get scanned.
We count everyone.
Compact sensors mounted at height track anonymous movement across every square foot: who slowed down, where they lingered, which zones they visited in what order, and who watched from the aisle without ever stepping in.
How it works
Traffic Tracker rides along with your existing booth build. Your attendees never notice it; your team never manages it.
We build a model of your booth and map its zones before the show floor opens.
Compact LiDAR sensors install at height or on trusses. WiFi provided by us.
Real-time anonymous capture: every visitor a dot, never a face.
A live private dashboard during the show; the executive report follows.
The vocabulary of the floor
Numbers you can defend under questioning. Each one has a precise definition, and the same definition applies at every show we measure.
| Metric | Definition |
|---|---|
| Impressions | Every entry into the booth footprint, counted by LiDAR, not estimated from badge scans. |
| Onlookers | Attendees within 4–5 ft of the perimeter for at least 2 seconds who never entered. Interest from the aisle, quantified. |
| Dwell vs. stationary | Total time in the booth vs. time spent standing still: browsing separated from engagement. |
| Qualified dwell | Visits longer than 60 seconds. The threshold where a pass-through becomes a visit. |
| Zone visits | Total and unique, per zone. Unique visits count real reach without double-counting. |
| Zone-to-zone flow | Flow diagrams showing which zones naturally pair in attendees' minds, in the sequence people actually walk. |
| Impressions per hour | The staffing chart. Peaks, lulls, and the lunch dip, by day. |
| Traffic & dwell heat maps | Your booth's "carpet friction": popular entrances, natural paths, and the dead corner nobody warned you about. |
From data to decisions
A metric is only worth what it changes. These are the moves our clients make from the patterns Traffic Tracker surfaces.
Because the methodology is identical across every exhibitor we measure, your numbers can be benchmarked against comparable booths at the same show and across shows. Benchmarks are confidential to participants and never shared outside them.
Not all tracking is equal
Exhibitors have options for measuring booth traffic. Only one covers the whole booth, respects privacy, and reports in real time.
| Technology | Privacy-safe | No opt-in needed | Real-time | Full booth coverage | Accuracy |
|---|---|---|---|---|---|
| Traffic Tracker™ (LiDAR) | Yes | Yes | Yes | Yes | 5 out of 5 |
| Facial recognition cameras | No | No | No | Yes | 4 out of 5 |
| RFID badges | Yes | No | No | No | 3 out of 5 |
| Bluetooth beacons | Yes | No | No | No | 2 out of 5 |
| WiFi tracking | No | Yes | No | No | 2 out of 5 |
| Infrared counters | Yes | Yes | No | No | 2 out of 5 |
Based on Reality Engineering's review of passive traffic-tracking technologies; market averages. Real-time reflects how results are typically delivered to exhibitors during the show: most alternatives batch-process and report after the fact, even where the sensors themselves capture continuously.
Questions we hear
Badge scanning captures who said yes. Traffic Tracker captures everyone else. Most booth visitors never get scanned. Traffic Tracker measures the full audience your booth actually earned, and shows how the scanned minority relates to it.
No. Visitors are represented as anonymous data points: no names, no faces, no devices tracked, and zero attendee consent required. By anonymizing visitors as simple dots, LiDAR avoids the privacy concerns raised by facial recognition entirely.
Sensors are compact, mount discreetly at height (including inside trusses), and connect over WiFi we provide. We plan placement against your booth layout in advance, so install adds no meaningful time to your build.
You are not buying a report. You are buying decision certainty. Traffic Tracker pays for itself in the decisions it improves: booth size, layout, staffing, content, and which shows deserve your budget next year.
The payoff
The heat maps, the zone flows, the hour-by-hour curves, the benchmarks: one document your leadership actually reads, with recommendations attached to every finding.
